3 – Global Product Launch Performance Management
Providing leadership with a single executive view of global product launch performance and accountability
Business Background
Sensormatic managed dozens of strategic product launches each year across North America, EMEA, APAC, and Latin America. Before a product entered development, regional product leaders submitted business cases with five-year revenue forecasts and market projections.
Once products entered development, leadership needed a consistent way to determine whether regional commitments translated into actual business performance.
Managing those launches across multiple regions, different launch schedules, and numerous stakeholders had become increasingly difficult.
Key Features
• Adoption curves
• Revenue tracking
• Product group segments
• Regional filters
The Opportunity
My manager, Director of Global Product Management, often summarized the challenge the same way:
"We need a way to hold their feet to the fire."
Regional teams requested new products and committed to revenue forecasts, but once products launched there was no single executive view connecting promised results with actual performance.
Leadership needed more than reports. They needed operational accountability across every product launch.
Solution
I designed an executive performance management system that integrated product roadmap information with operational and financial data from MicroStrategy, Oracle, Power BI, regional reporting, and software business units.
The framework monitored:
Product development status
Launch schedules
Regional commitments
Monthly shipments
Revenue performance
Forecast attainment
New product contribution to company revenue
Every launch could be monitored from development through commercialization using a common executive framework.
Design Approach
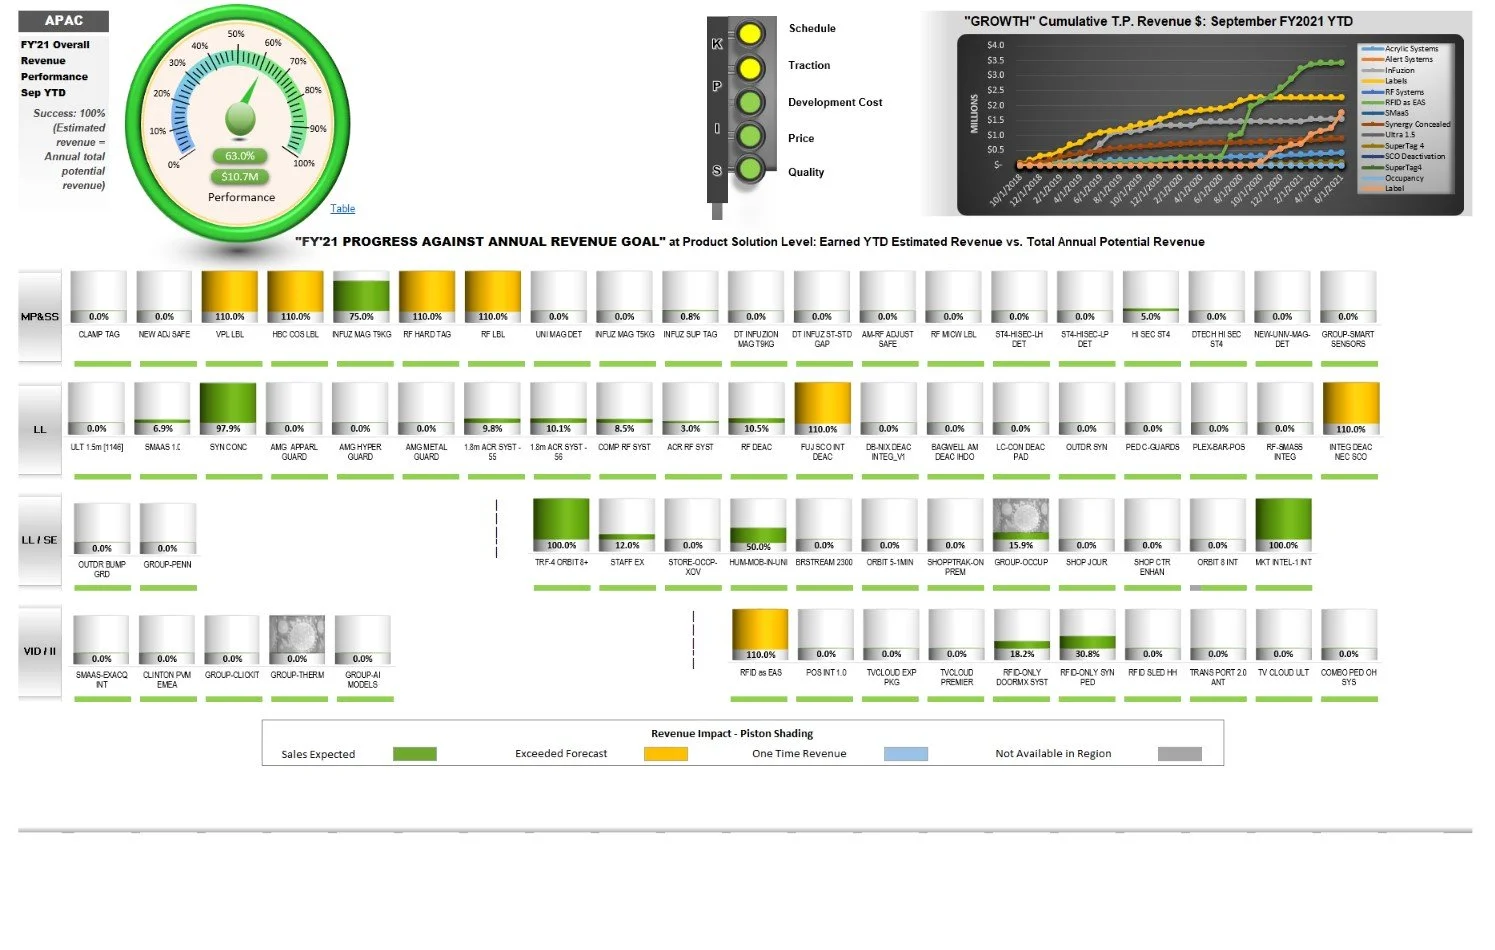
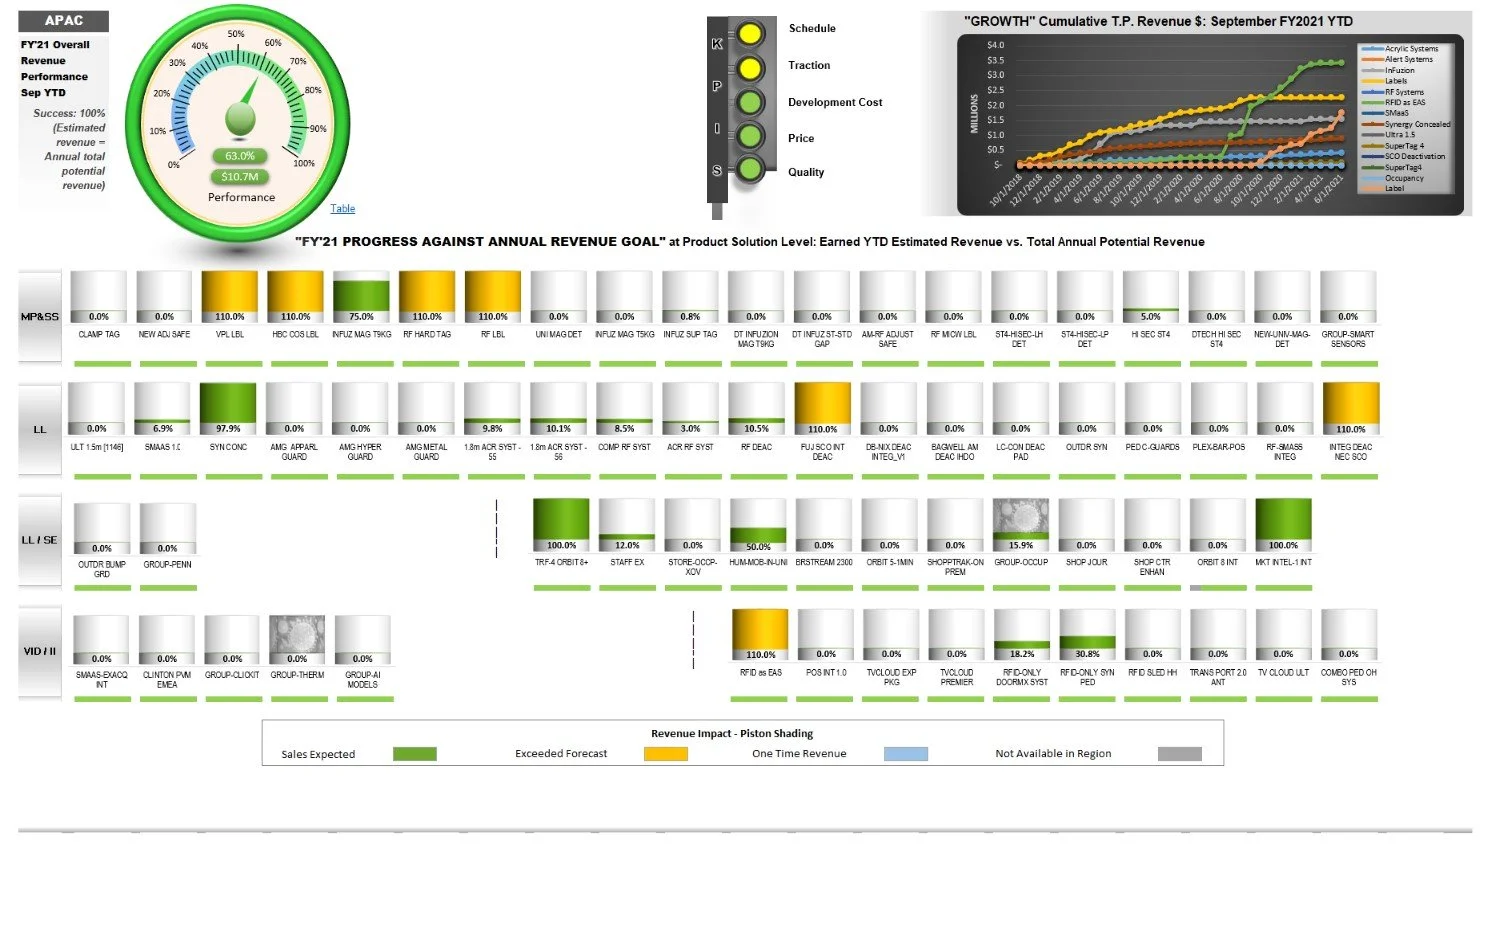
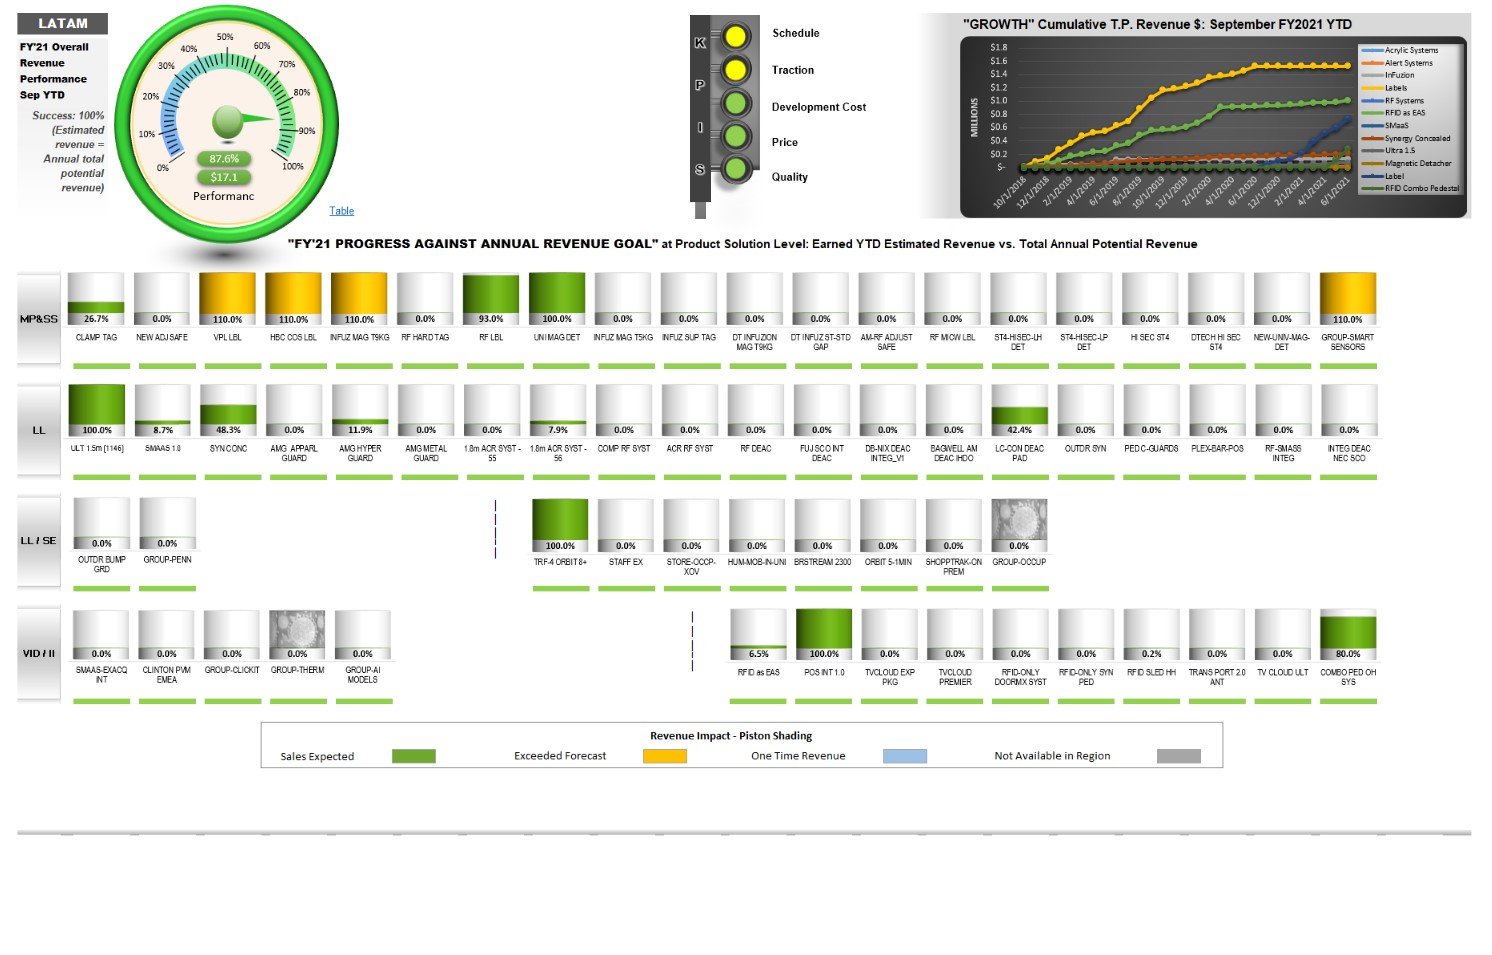
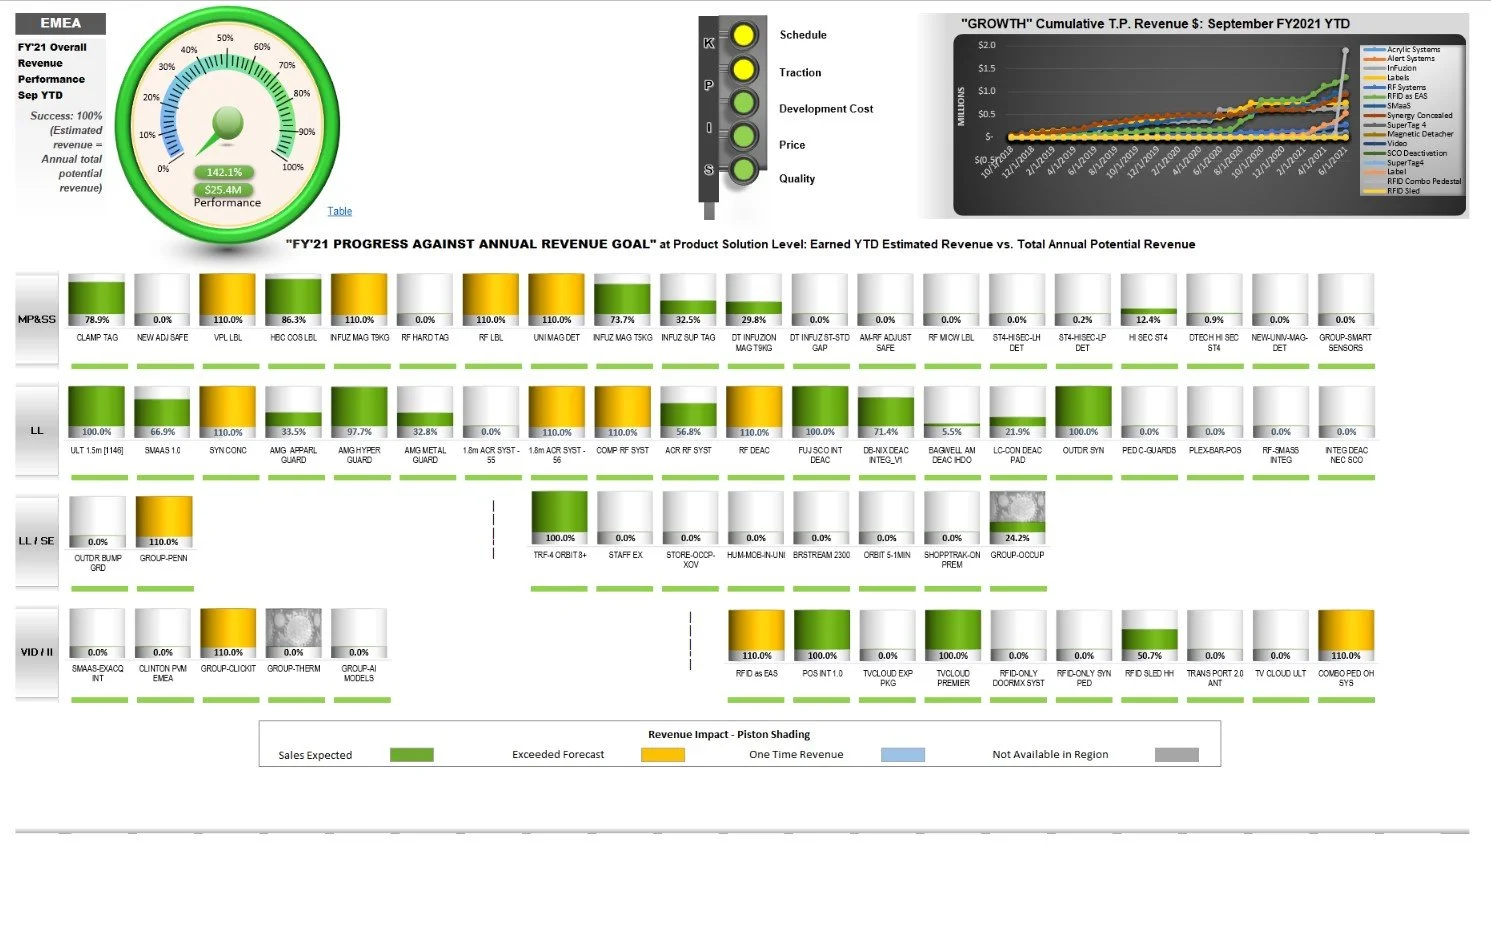
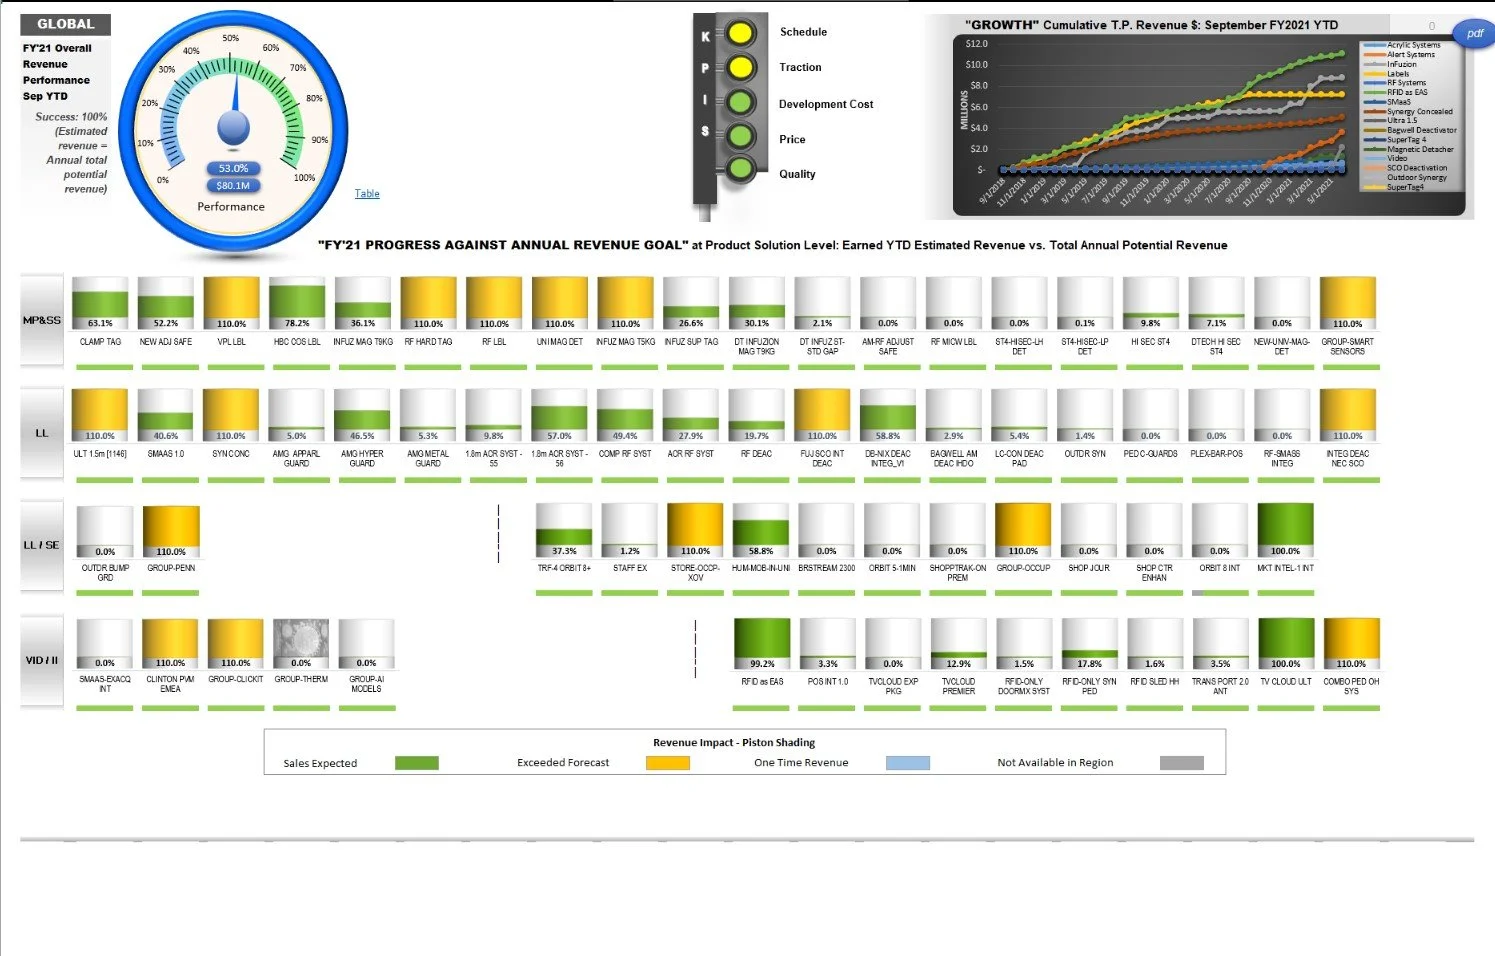
Rather than producing separate reports for every product and region, I designed a series of one-page executive scorecards that combined operational status, financial performance, development milestones, and forecast progress into a single visual.
Inside the organization, these became known as the "Piston Charts."
Executives could immediately identify launch risks, forecast gaps, and regional performance without reviewing multiple reports.
The charts became the operational command center executives relied on to manage global product launches.
Organizational Impact
The framework quickly became the primary executive reporting system for new product launches.
It supported monthly executive reviews, compensation reporting, regional product management, and strategic planning.
The reporting system:
Managed performance across 30 - 50 active launches
Became the standard reference for launch performance
Became the trusted reporting source for Compensation and executive leadership
Improved accountability across global product teams
Helped monitor new product contribution from approximately 25 - 30% toward more than 40% of company product revenue
The value wasn't the dashboard. It was giving executives confidence that global product launches were delivering the business results they were approved to achieve.
Global View
Regional Views