Case Study 4
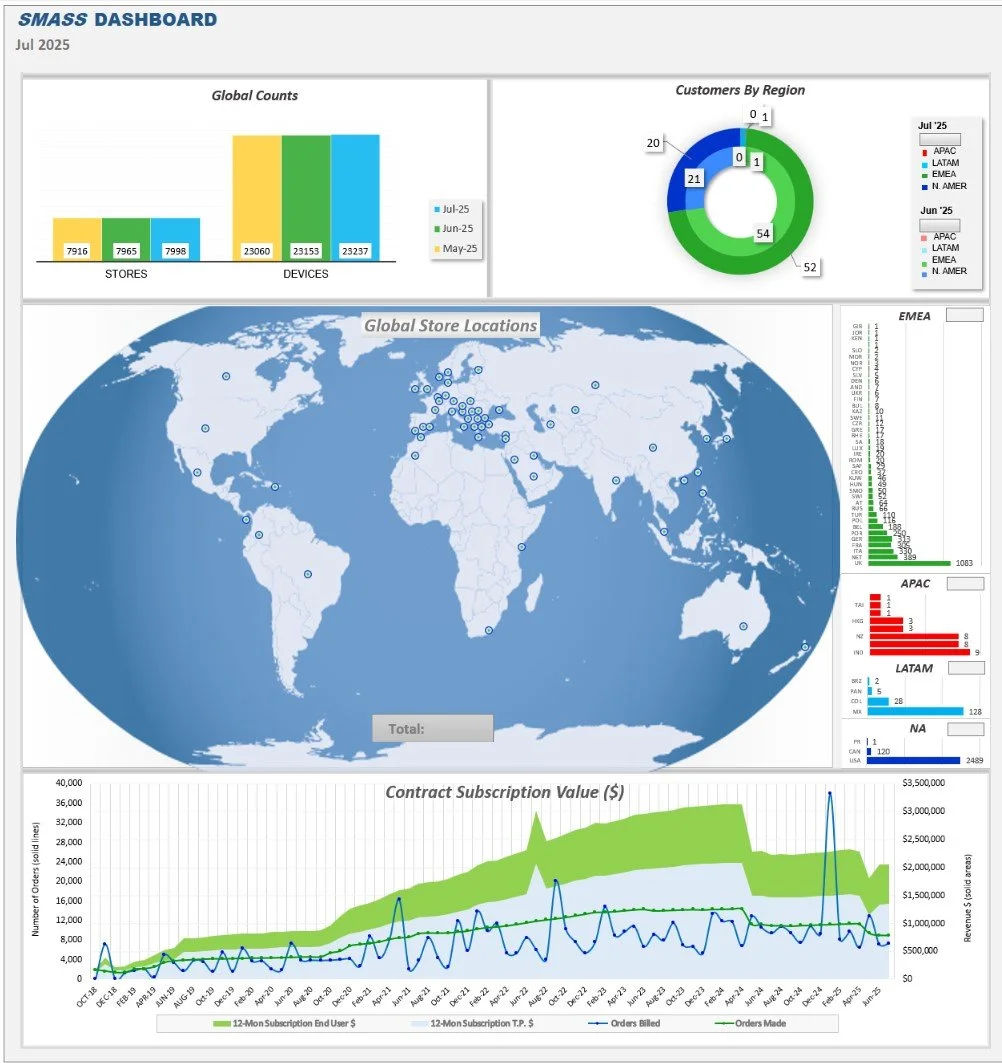
Software Dashboard Summary Page
AI Tags: Analytics • KPI Framework • Automation
Tools: Power BI • Snowflake • Oracle • Salesforce • MicroStrategy
Overview
A unified executive dashboard designed to consolidate product, regional, and customer performance into a single, decision‑ready view for leadership and cross‑functional teams.
Problem
Teams were working from fragmented reports, slowing decision cycles and creating inconsistent interpretations of performance metrics.
Solution
I built an interactive Power BI dashboard integrating data from Snowflake, Oracle, Salesforce, and MicroStrategy. The design emphasized KPI tiles, trend lines, and drill‑downs, with a visual hierarchy tailored for fast, cross‑functional decision‑making.
Impact
• 40% reduction in manual reporting time
• Improved alignment across product, sales, and marketing
• Faster weekly and monthly business reviews
Key Features
• KPI tiles
• Trend analysis
• Drill‑downs
• Multi‑source integration
• Automated refresh cycles