2 – Market Intelligence for Revenue Growth
Helping leadership identify where revenue opportunity, market penetration, and competitive advantage intersect
Business Background
The Palm Beach Post subscribed to multiple syndicated research services that tracked advertising spending across television, newspapers, radio, and other media channels.
One of the richest data sources came from Kantar Media, providing detailed advertising expenditures across industries and competitors.
Although valuable, the information arrived as large flat files and was primarily summarized in monthly written reports.
I believed the data contained far more strategic value.
The Opportunity
Rather than simply reporting what had happened, I wanted to answer questions executives actually needed answered.
Which industries represented the greatest revenue opportunity?
Where were competitors outperforming us?
Which market segments deserved greater sales investment?
Where could we gain market share most quickly?
Solution
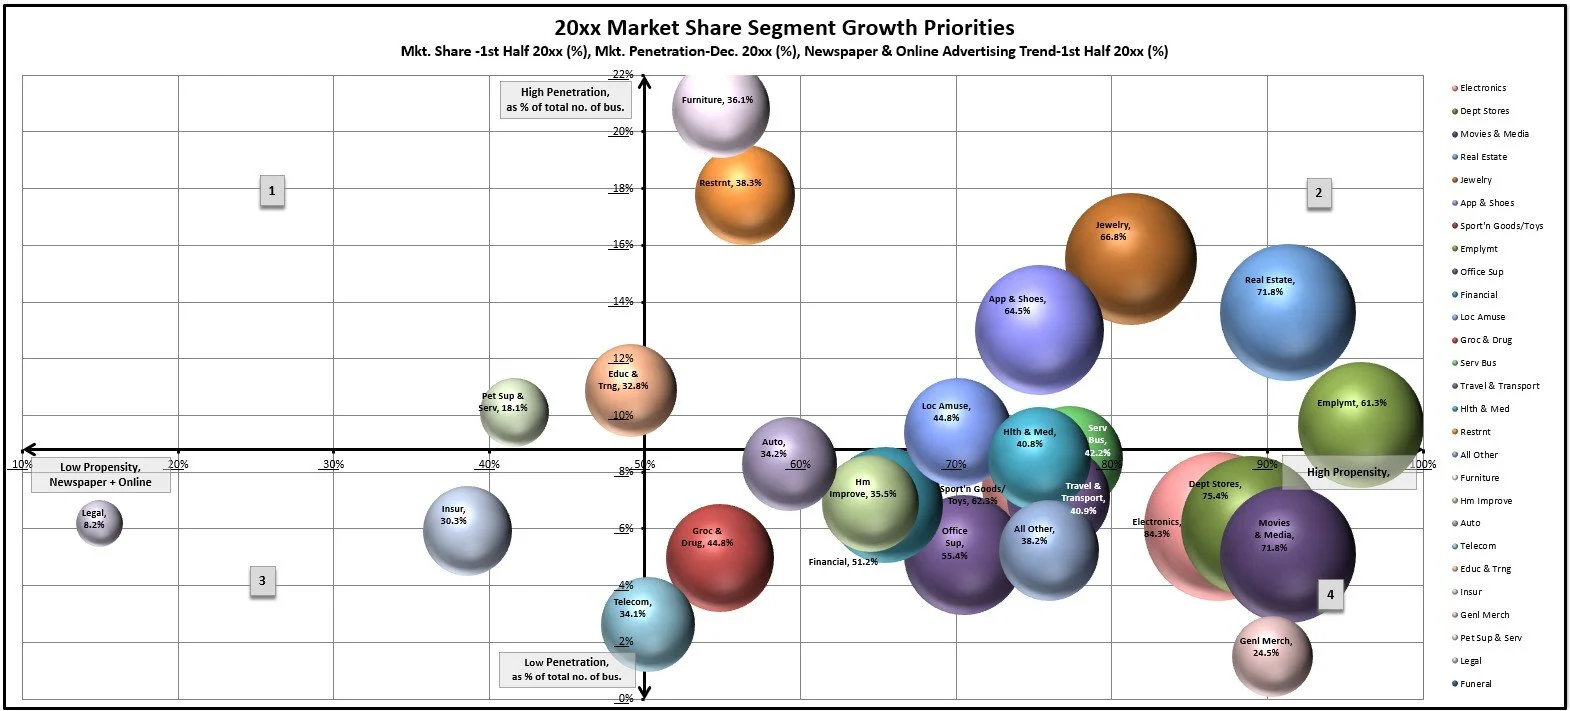
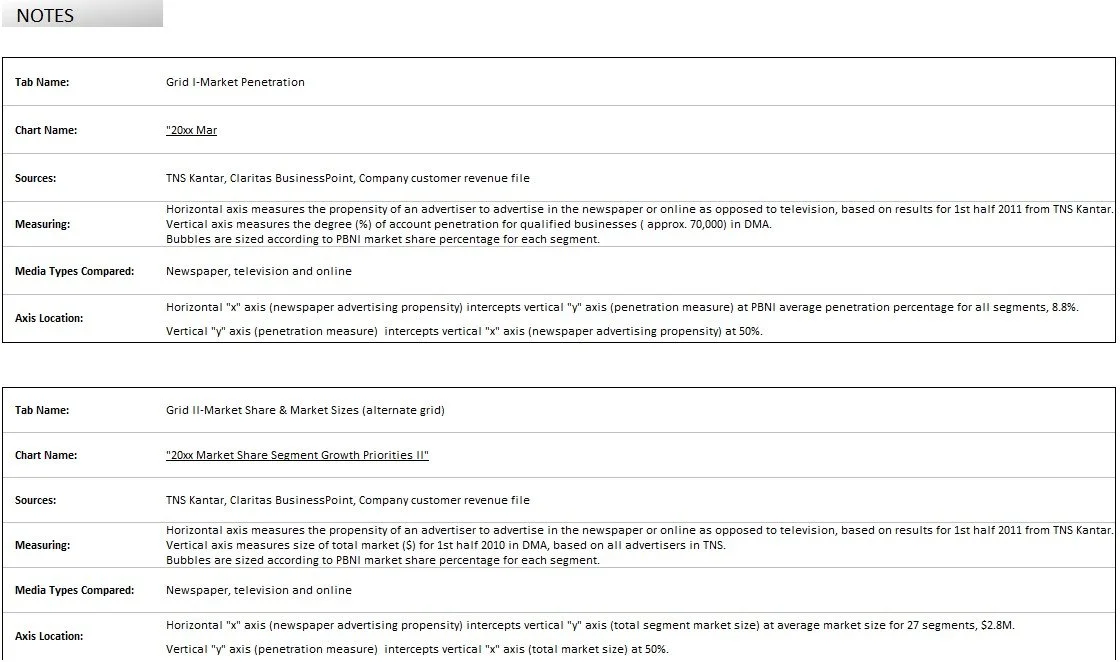
I integrated syndicated Kantar data with internal advertising revenue to create a segmentation framework measuring market penetration, revenue share, and growth potential across major business categories.
Design Approach
I designed an executive market intelligence framework that combined syndicated advertising data with internal business performance.
The framework measured:
Total market opportunity
Market penetration
Competitive advertising spend
Growth potential
Revenue share
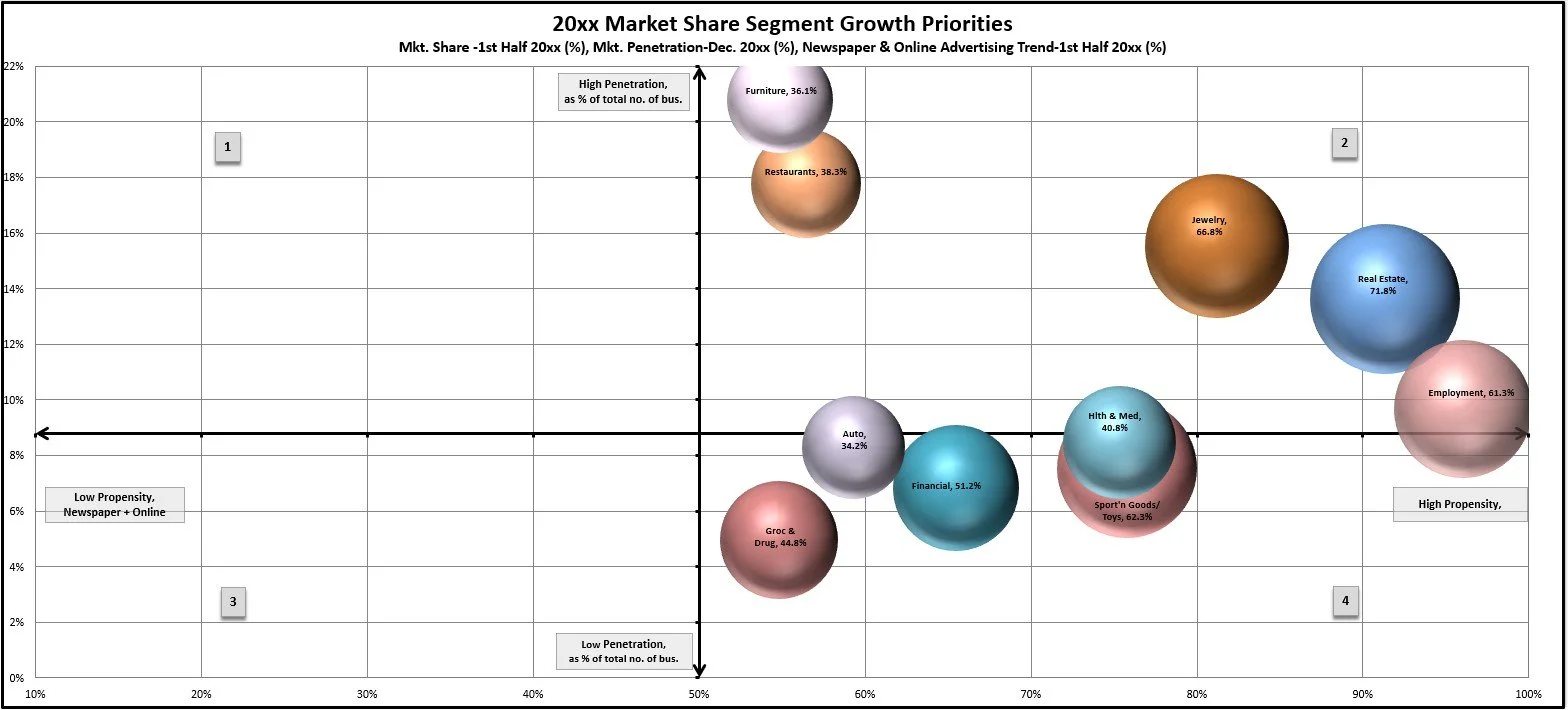
Rather than presenting dozens of tables, I designed visual decision maps that immediately highlighted where revenue opportunity, market penetration, and growth potential intersected.
Each visualization summarized multiple business variables into a single view, allowing executives to identify high-priority growth opportunities within minutes instead of reviewing lengthy reports.
Inside the organization these became known simply as "the Bubble Charts."
Executive Insight
Inside the organization, these visual decision maps became known simply as "the Bubble Charts."
The name reflected the goal: transform complex market intelligence into visuals executives could understand immediately and use to guide strategic decisions.
Organizational Impact
The project began as a self-initiated analysis.
After reviewing the work, my director presented it to executive leadership.
I was subsequently invited to present the findings to the President of Advertising Revenue and senior leadership.
The framework became a cornerstone of the company's 2011 and 2012 sales planning process, guiding:
Industry prioritization
Sales targeting
Marketing strategy
Special advertising inserts
Revenue planning
As a result:
Market share increased by 6 percentage points across three strategic market segments
Executive decision-making shifted from intuition toward market intelligence
I became responsible for ongoing strategic market analysis for the organization
12-Month Sales Revenue Growth in Key Segments
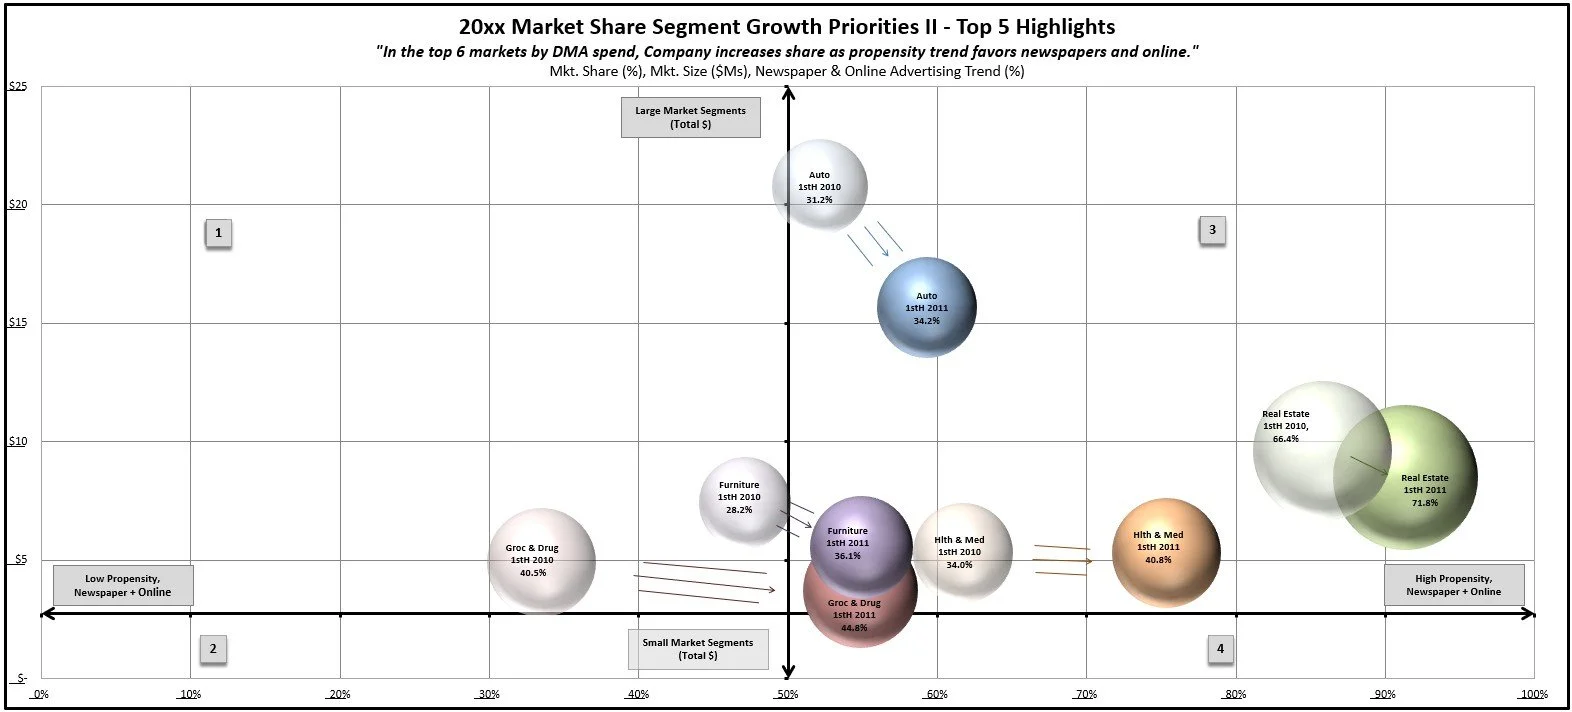
High Value Growth Segments, High Growth Segment Opportunities
27 Market Segments Analyzed